A Friendly and Important Disclaimer Note (in
addition to legal language below): If you’re reading this post and are not currently investing with Soos Global (which, of course, is
something we should discuss!), please bear in mind that while we share details
on changes made to our portfolios, it's important to consider that our
portfolio decisions are taken in a much broader context of our overall
portfolio strategies and our assessment of each of our investor's unique
financial profiles. As such, what we do, and when we do it, is specific
to our investor portfolios and is NOT intended, in any way, as advice for use
by others. Readers are reminded that all comments posted here are for information
and entertainment purposes only!
Any commentary, especially those that include specific mentions of
'buying' or 'selling' or 'positions', is made solely for those limited
informational and entertainment purposes, and NOT as advice.
Thanks for reading. And please
email or call w/any questions or to discuss in more detail. Also,
please visit http://stockcharts.com/public/1587236
to see our charts of close to 100 stocks/etfs on our radar screen.
Best, Ed
(If you'd like to exchange thoughts on this post or on other subjects, please connect with me through the Private Chat tool on the right side of this page, or if you'd like to email thoughts, please do so through the Contact Form feature. For public airings, please use the Comment feature below. Looking forward to hearing your thoughts!)
(If you'd like to exchange thoughts on this post or on other subjects, please connect with me through the Private Chat tool on the right side of this page, or if you'd like to email thoughts, please do so through the Contact Form feature. For public airings, please use the Comment feature below. Looking forward to hearing your thoughts!)
On the heels of yesterday’s equity market rout, it’s worth
considering the move in context, namely, relative to where the market has been
in recent months, and relative to where it’s been over the past couple of
years. The charts below reflect both.
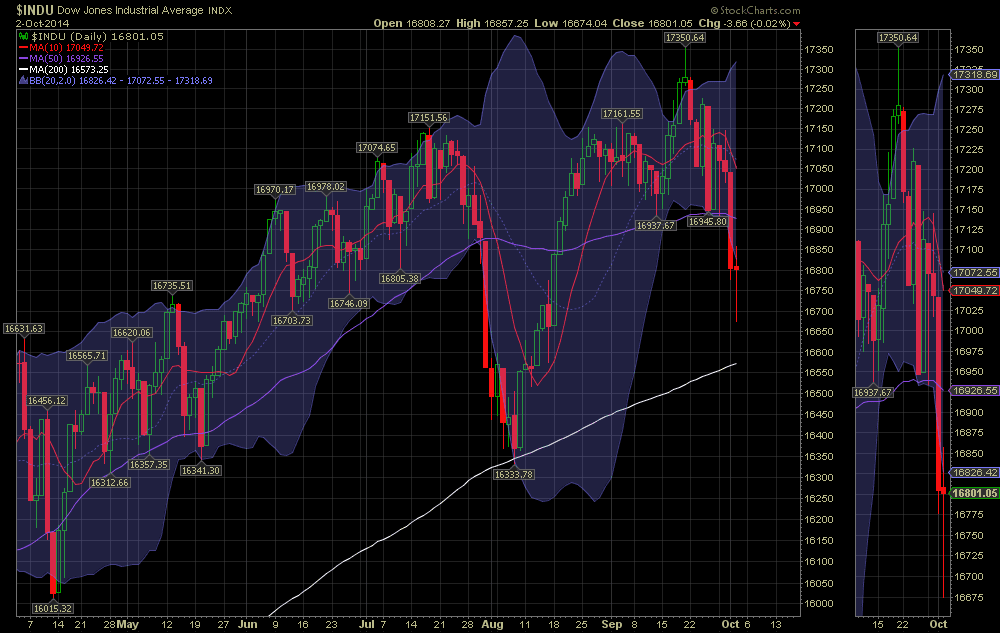
The first chart, showing recent months, is particularly
troubling, especially the ‘thumbnail’ on the side that highlights the activity
in recent days in which the DJIA broke down aggressively below its recent
trading range (note: the shaded blue area shows and +/- 2 std. dev. range
around the previous 20-day simple moving average of prices).
The second chart shows the past two years’ price
history. It’s a healthy reminder of just how far the market has come, and
depending on your fundamental outlook, could raise concerns about a major
market pullback that would make yesterday seem like a rounding error!!
Conversely, what looked like an awful setback yesterday, might
really have been only a small move in the larger context, and along those lines
(pun intended), one could also note that several times over the past two years,
the market ‘corrected’ (not literally, which would be a 10% move, but more
figuratively in the form of a major selloff that broke the uptrend at that
time), and each time, the 200 dma (white line) was the support from which the
market resumed its uptrend.

Which will it be this time????
We’ll see.
But away from the day-to-day gyrations, the underlying
global macro view that I shared in recent missives still stands. I think
a continued pullback in equities is likely, though I don’t anticipate an
‘Armageddon’! I think the Fed will begin to raise rates in H1 ’15, but
only moderately and in slow, measured, well advertised steps. With all
kinds of commodity prices having fallen in recent months, most notably in the
energy and agricultural space (see charts below of commodity indexes), and with
plenty of excess capacity still in manufacturing and labor, there’s no evidence
of prices pressures that should force the hand of the Fed to move more
aggressively.

I think that when bond markets overreact to
anticipated Fed moves and, in turn, the bond market sells off hard, it makes
sense to consider adding fixed income for a relatively small portion of the
portfolio (as we’ve done last week). On equities, though I am concerned
about upcoming earnings meeting expectations and justifying current valuations,
I don’t see grotesquely high PEs in general that would cause concern about a
broad market ‘correction’ (literally this time, meaning 10%). I don’t see
that. With the S&P currently at roughly 18x PE, and with companies
generally in ‘lean & mean’ conditions on an operating leverage basis and on
a balance sheet debt/equity basis, it’s hard to find too many signs of a
bubble, except perhaps in small-cap land, which btw, would explain the recent
10%+ selloff from July highs.
I continue to use cash to selectively buy what appear to be
undervalued names in the various themes that drive our strategies, with
particular focus on the ‘emerging middle class’ theme keeping our exposure in
consumer discretionary and technology quite high. I’m also looking at EM
countries where currencies have fallen in value vs the USD on its recent
run-up, and where local currency debt and equities have slipped. At some
point, when the USD tops, those EM local currency bonds and equities could be
compelling.
Will keep you posted.
Best,
Ed
Please continue to visit Soos Global Market Musings for updates.
(Sign up to "Follow by Email"! And share with others!)
(Please note: This article is solely meant to be thought provoking and is not in any way meant to be personal investment advice. Each investor is obligated to opine and decide for themselves as to the appropriateness of anything said in this article to their unique financial profile, risk tolerances and portfolio goals).
Disclaimer: Please read and consider important information related to all communication made by Soos Global on this site by clicking here.
Additional Disclaimer: currently long many stocks/ETFs. Positions may change at any time without notice.